Buyers ask this in the first email: how long will the line take to pay back? It is the right question, and it cannot be answered by the supplier, because the answer is built from numbers that belong to you — the price your finished product sells for, the raw material you can actually buy, the hours your factory will really run, and the cost base you already carry.
What a supplier can do is help you build the model correctly and confirm the technical side of it: what the line produces under defined conditions, what the connected load is, which items belong in the investment, and which performance statements are conditional. This guide gives that structure. Every quantity in it is written as a variable, because the only honest way to publish a payback model for an export project is to publish the method rather than a number.
1. What payback measures — and what it does not
Simple payback answers one narrow question: how long does it take before the net cash the project generates equals the cash that was committed to it? It is a screening tool. It deliberately ignores what happens after the payback date, the residual value of the machines, how the project is financed and any strategic reason for owning the capacity.
Return on investment answers a related but different question: how large is the annual net benefit relative to the money committed? Expressed as a ratio, it is usually quoted over a defined period, for example the average annual net benefit across the first several years of operation.
Both are only as good as their inputs, so the model needs one more column before it means anything: a status for every assumption. Mark each line confirmed — meaning it comes from an invoice, a contract, a utility bill or a sample test — or to be confirmed. A payback figure built on unlabelled assumptions is not a number, it is a hope with a decimal point.
One rule protects the whole exercise: choose a convention once and keep it. Decide whether the net benefit is before or after tax, whether the investment includes financing cost, and whether depreciation is in or out. Changing the convention halfway through a comparison is the most common reason two models of the same project disagree.
2. The investment side: what belongs in the denominator
The denominator of a payback calculation is not the machine invoice. It is every cash item that has to be committed before the line earns anything. Buyers who use only the invoice price are, in effect, modelling someone else's project.
| Investment item | Include when | Where it usually gets lost |
|---|---|---|
| Machines from the first to the last stage in scope | Always — with the boundary written machine by machine | Two quotations describe different line boundaries and are compared as if they were the same |
| Conveyors, controls and inter-machine wiring | Whenever the line runs as one connected route | Treated as accessories rather than as part of the route |
| Packing, freight, insurance and port charges | Always — whichever side of the delivery term pays them | The delivery term is not read carefully, so the same leg is counted twice or not at all |
| Installation, commissioning and training | Always — remote guidance or on site | On-site travel, accommodation and local riggers are assumed to be included |
| Buyer-side factory works | Whenever the site is not already ready | Civil work, power connection, water supply, drainage and the cold-room shell sit on somebody else's budget |
| First-period spares and consumables | Always for the first operating period | Assumed to be zero until the first breakdown |
| Working capital | Always — raw material, oil, packaging and unsold stock | Never appears on a quotation, so it never appears in the model |
| Contingency | Whenever the building or the supply is not fully surveyed | Removed to make the payback look shorter than the project justifies |
Working capital and buyer-side works are the two omissions that flatter a model most, and both are real cash. Material has to be bought before anything is sold, and the electrical connection, water supply and drainage have to exist before the line can be commissioned. The utility planning guide covers the supply side of that list in detail, and the cost factor guide explains why two quotations for what looks like the same line are not comparable until the scope behind them is stated in writing.
3. The output side: build from working hours, not from the rating
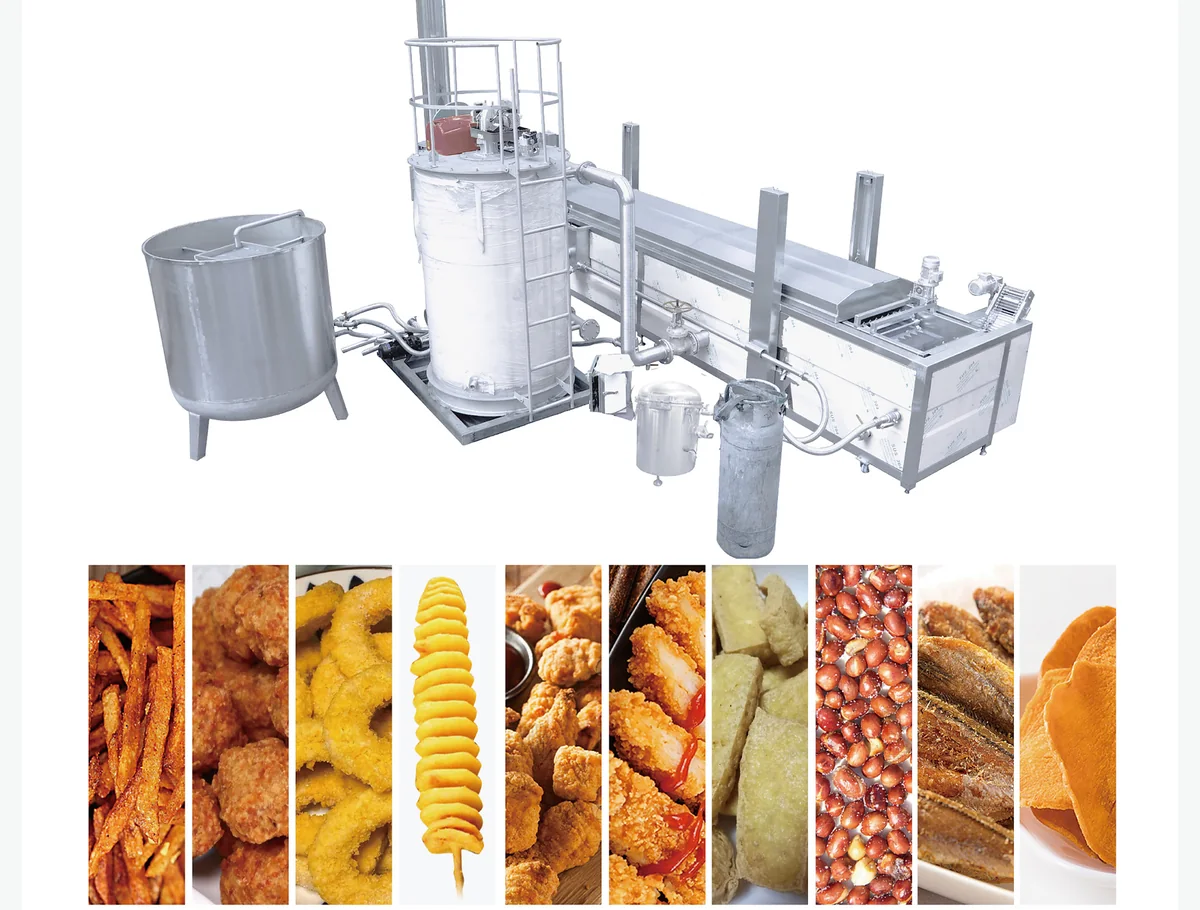
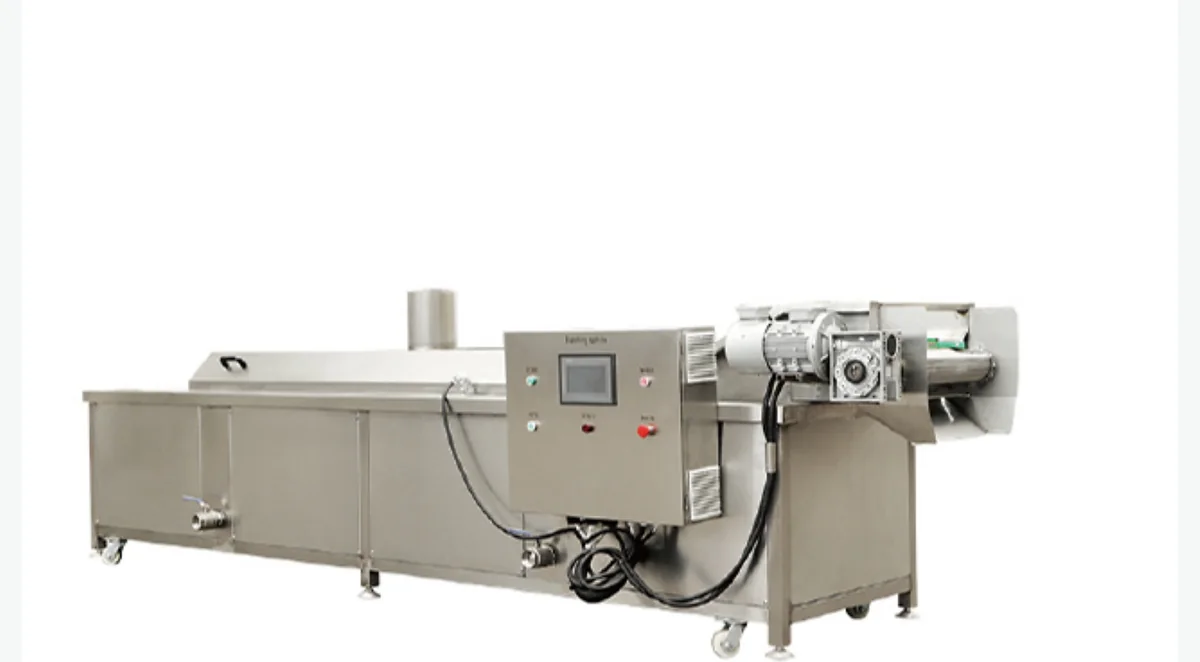
The revenue side of the model starts with kilograms actually sold, and those come from hours actually run. A line rating is an indicative figure for a defined product and a defined condition. As an illustration of how one module scales across a range, the published figures for the continuous belt fryer go from model LY4000 at 120 kW electric heating power with an indicative capacity of 100–200 kg/h, up to model LY8000 at 200 kW with an indicative 300–800 kg/h. Those are indicative values across the model range, not a commitment for your product, your slice thickness or your frying curve.
The working formula for annual finished output is short:
- Annual finished output = finished output per hour × productive hours per day × operating days per year × utilisation factor
- Productive hours = shift hours minus start-up and shutdown, minus cleaning between products, minus changeovers, minus planned maintenance
- Utilisation factor = the share of those hours the line is really running, after raw material availability, demand, breakdowns and operator availability are taken into account
Two of those inputs are habitually overestimated. The first is productive hours: a factory that plans two shifts does not get two shifts of output on the day it changes product twice. The second is raw material availability — where the line is fed by a seasonal crop, annual output is capped by the harvest window, not by the machine, and the same capital equipment then works a fraction of the year.
Keep raw input and finished output strictly apart in the model. Peel and sorting losses, trimming and moisture loss during frying are all real, and the yield between the two ends is a result of a sample test on your own material rather than a figure that can be borrowed from a brochure. Valuing raw intake as if it were finished product is one of the most effective ways to make a project look viable when it is not. The capacity tiers and what each one changes behind the machines are covered in the capacity planning guide, and the difference between the chilled and the frozen route — which changes both the investment and the revenue side — is explained on the buyer education site in the comparison of fresh and frozen fries production.
4. The cost side: fixed, variable and step costs
On the cost side the useful split is not accounting categories but behaviour: which costs change with every kilogram produced, which ones are paid whether the line runs or not, and which ones jump in steps.
Variable — moves with output
Raw material, oil make-up and oil replacement, packaging, the energy consumed in heating and cooling, consumables and outbound handling. In most fries line models raw material is the single largest variable line, which is why a small change in procurement price moves the payback more than a large change in machine price.
Fixed — paid per period
Operators and supervision for the shift pattern, planned maintenance and spares, insurance, quality testing, occupancy and the cost of the money invested. These have to be covered in every period, including the periods when the line is idle.
Step costs — jump and stay
Some costs do not move per kilogram and do not stay flat either: a second shift, an additional boiler or heat source, a larger transformer or a generator. Put each one in the period in which it starts, not as a smooth per-kilogram figure.
Energy deserves its own discipline, because it is recorded at two different levels. Connected load is what the site must be able to supply, and it decides the panel, the cable, the transformer and sometimes the generator. Running consumption is what the meter records, and it is the figure that belongs in the per-kilogram cost. Mixing the two is the classic utility error: it either makes the electrical scope look trivial or makes the operating cost look impossible.
5. The two formulas, written out
Once the inputs exist, the arithmetic is simple. Writing it out is still worth doing, because it shows exactly where the model can be manipulated.
- Simple payback (years) = net investment ÷ annual net cash benefit
- Annual net cash benefit = annual sales revenue − annual cash operating costs. Exclude depreciation if you are modelling cash; include interest and fees if your convention treats financing as part of the project. State the convention and stay with it.
- ROI = annual net cash benefit ÷ net investment, quoted over a defined period such as the average annual benefit across the first several years
- Incremental payback for automation = extra investment ÷ annual cost reduction actually removed, plus any quality, uptime or rework benefit the buyer can genuinely quantify
- Breakeven utilisation = the utilisation level at which the annual net cash benefit is zero
Breakeven utilisation is often the most useful output of the whole exercise, because it converts an argument into a question the buyer can answer: can this line realistically be kept above that level of output for the year? If the answer is yes, the project is worth pricing in detail. If the honest answer is no, a better price will not fix it.
6. The assumptions that move the answer most
Not all inputs deserve equal attention. A sensitivity pass over the model shows which ones change the answer enough to argue about, and which ones can safely stay as estimates.
| Assumption | Why it moves the answer | Where your number comes from |
|---|---|---|
| Selling price of the finished product | Multiplies directly with every kilogram sold | Your own market, contract or distributor terms |
| Raw material price and availability | Usually the largest single variable cost, and seasonal | Local purchase records or supplier terms, averaged over a full year |
| Working hours and utilisation | Divides the fixed cost base over output | Your own shift plan and demand forecast |
| Yield from raw input to finished output | Sets how many kilograms are sold per kilogram bought | Peel, trim and moisture losses measured by sample test on your own material |
| Oil consumption and turnover | A recurring cost that scales with running hours | Your own trial data and the filtration practice you plan to follow |
| Energy tariff and running hours | Recurring and proportional to the heating load | Your own utility bill, at the tariff you actually pay |
| Labour cost and crew size | Fixed per shift and paid whether the line runs or not | The local wage level for the roles the line needs |
| Cost of finance | Fixed and paid every period | Your own bank terms |
The practical use of the table is a downside case. Take the two assumptions with the greatest effect and move them against the project at the same time — a lower selling price and a lower utilisation, for example — then check whether the payback period is still acceptable. A project that only works in its base case is not a project with a payback period, it is a project with a favourable spreadsheet.
7. How capacity tier and automation change the shape of the model
A larger capacity tier does two things at once. It spreads fixed costs across more kilograms, which lowers unit cost, and it raises both the investment and the fixed cost that has to be covered every month. The second effect is the one buyers underestimate: because fixed costs are paid in full whether the line runs or not, a higher tier is more sensitive to utilisation, not less. Choosing a tier for demand the market does not have yet is the most expensive form of optimism available to a food factory.
Automation changes the shape in a different way. Raising the automation level moves cost from labour hours to investment: the machine share of the project grows, and the dependence on crew size and operator discipline falls. Two consequences follow for the model. First, the payback period depends on how many shifts the line really runs, because a saving that is only realised on the second shift does not exist in a one-shift operation. Second, it depends on product stability, because changeover time is where the economics of a connected route are most easily lost.
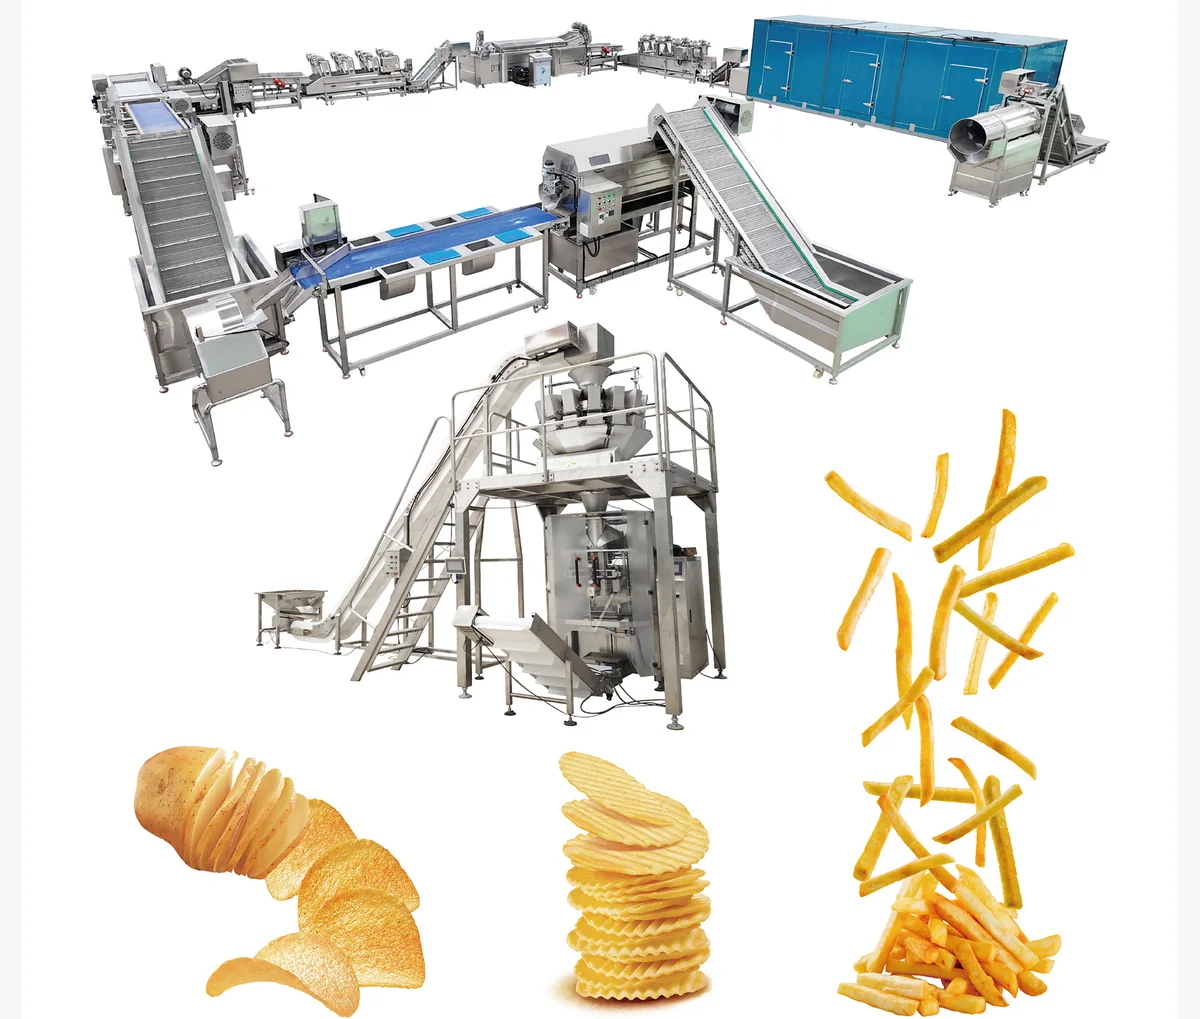
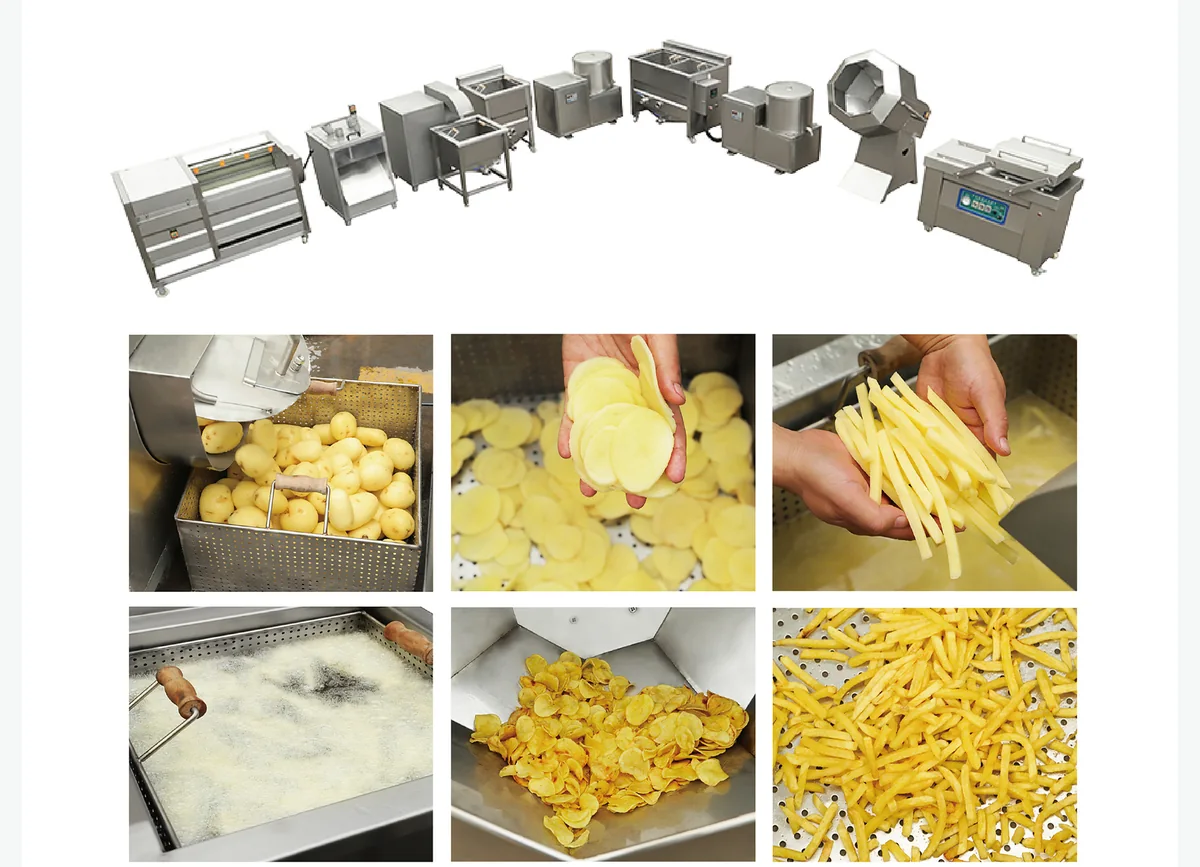
The current line configurations are shown on the automatic French fries and potato chips line page and on the semi-automatic configuration page. The useful question is not which one sounds better, but how many hours per year the line will actually run, and how much of the labour it replaces will genuinely leave the payroll.
8. Five ways a payback model flatters itself
These are the recurring failures seen in project models, in rough order of how much difference they make.
- Rated capacity used as output. A model that multiplies the indicative rating by hours and days, at full utilisation and with no cleaning or changeover time, produces a revenue line the line cannot deliver.
- Working capital and factory works left out. Both are real cash and both are required before the first sale; omitting them shortens payback by a margin that has nothing to do with the machines.
- Quotations compared across different scope. When the line boundary, the automation level and the service terms differ, the cheaper quotation is not cheaper — it is smaller.
- Commissioning-week performance treated as steady state. The first operating period is a ramp: recipe tuning, operator learning and spare parts logistics all take time, and output during that period is lower than the design figure.
- Savings counted that never leave the payroll. An operator kept on for other duties is not a saving, and a rented space that is still rented is not a saving either.
Each of these can be corrected with one line of honesty in the model. None of them can be corrected by a supplier's discount.
9. What to prepare if you want the technical side confirmed
A supplier cannot build your business case, but the technical half of it can be made much more precise. The following information lets the investment basis and the performance basis be confirmed together, instead of one being revised after the other.
- Finished product, process route and the stages included, from the first machine to the last
- Raw input per hour or per day, and the working hours and shift pattern you intend to run
- Building drawing or measured floor area, with clear height at several points along the route
- Power supply basis — voltage, phase, frequency and available load — plus the position of the main panel
- Water source, pressure, drainage positions and the wastewater route
- Heating source available for frying, and any refrigeration or compressed-air provision
- Whether the site is ready or still to be prepared, so buyer-side works can be listed rather than assumed
- Delivery term intended, and the port or destination to be used
- Your own commercial inputs: expected selling price, raw material cost and finance terms
Items one to eight are what the technical offer is built on, and they are also the items that decide the size of the denominator in your payback calculation. The layout planning guide covers the building-side checks in more detail, and the RFQ checklist lists the project information that belongs with them.
Payback model checklist
- Line boundary written machine by machine
- Freight, insurance and port charges allocated to the correct side of the delivery term
- Installation, commissioning and training scope stated as remote or on site
- Buyer-side works listed: civil, power connection, water, drainage, cold room
- First-period spares and consumables included
- Working capital for raw material, oil, packaging and unsold stock included
- Output built from productive hours and a realistic utilisation factor
- Yield between raw input and finished output taken from a sample test
- Fixed, variable and step costs separated in the cost model
- Connected load and running consumption used in the right places
- Convention for tax, financing and depreciation fixed and applied consistently
- Downside case run with the two most influential assumptions moved against the project
- Breakeven utilisation identified, and answerable from your own market
Frequently asked questions
Can a supplier tell me the payback period of a French fries line?
No. Payback depends on numbers that belong to the buyer: the selling price of the finished product in your market, the raw material price you can secure, the working hours your factory will really run and your own cost base. A supplier can confirm the investment basis and the technical performance basis of the line, and can help structure the model, but the result is yours to own.
Should I use simple payback or a discounted calculation?
Use simple payback as the first screen, because it is fast and it exposes the two variables that matter most: the investment basis and the utilisation the project can really reach. Once the configuration is narrowed down, a discounted calculation adds the time value of money and the costs that continue after the payback date.
What are the two items buyers most often leave out of the model?
Working capital and the buyer-side factory works. Raw material stock, oil and packaging tie up cash before the first product is sold, and civil work, power connection, water supply and drainage are normally not on the machine invoice. Both are real cash, and both lengthen payback when they are included honestly.
Does a bigger or more automated line pay back faster?
Not automatically. A larger tier lowers unit cost but raises the fixed cost that has to be covered every period, so it is more sensitive to utilisation. Automation shifts cost from labour hours to investment, which only pays back if the hours are actually run and the labour it replaces genuinely leaves the payroll.